Web Only version: Multiple sequence alignment and phylogenetic tree construction
16 Apr 2024NEW TEMPLATE FILE
There is a new template 2 file. Please download it and use it to replace the old one in your repo.
Edit Template on Gihub
Since Jetstream is down you can just edit the Assignment_3_template_2.Rmd file straight on github.com. Will demo at the beginning of lab.
Orientation
We would like to better examine the evolutionary origin of the virus causing the respiratory disease outbreak. In the last lab we used tools in R to narrow down our BLAST results to a manageable number of sequences and to create a new FASTA file that had just the sequences that we wanted.
Today we will do a multiple sequence alignment on those sequences and then build a phylogenetic tree.
Basic background on multiple sequence alignment and phylogenetic trees can be found in Chapter 9 of Bioinformatics for Beginners. You can access this through the library VPN.
Download the sequences
You don’t need this to complete the lab, but if you want the final (unaligned) set of sequences from the tidyverse lab, you can download them here
Multiple sequence alignment
There are many sequence alignment algorithms and programs. I have used MAFFT because it is reasonably quick and does a reasonably good job. Obtaining a good alignment is as much of an art as a science. I tried a few settings and found that we had to reduce the gap opening penalty to get a good alignment.
It takes about an hour to align (remember this is a big file, 196 sequences up to 24,000 bases in length). I give the command below, but YOU DO NOT NEED TO RUN THE COMMAND BELOW. IT WILL TAKE AN HOUR. DOWNLOAD MY RESULTS INSTEAD
#time mafft --maxiterate 100 --thread 3 --reorder --op 0.5 selected_viral_seqs_195V2.fa > mafft_maxiter100_195_op.5.fa
There is also a web interface at the MAFFT link above; if you use the web interface be sure to change the settings to match above. (I haven’t tested the web interface to see if it will run a file this big or not)
View alignment
Download the MAFFT aligned sequences here
It is always important to view your alignment to see if the aligner seems to have done a good job. There are many alignment visualization packages and websites. One that I like is Wasabi.
Go to Wasabi now to view the MAFFT output file. You can do this from your instance or from your own computer. You do not need to create a Wasabi account.
At Wasabi, click on the left most icon (document icon) to upload (import) a file. Select and upload the mafft_maxiter100_195v2_op.5.fa file
STOP and THINK: What is each row? What is each column? What are the colors?
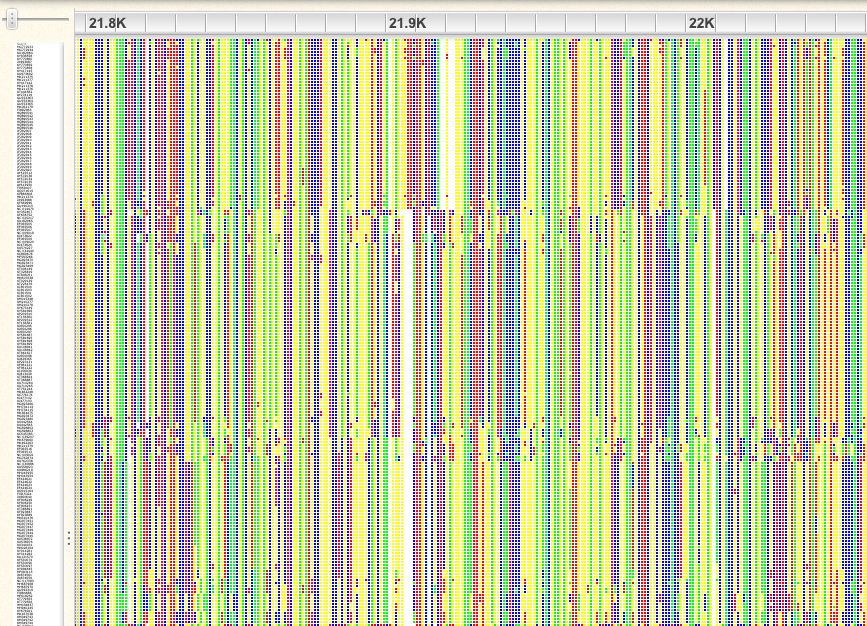
Click on the “-“ icon to zoom out; I recommend zooming so far out that you just see colors, not letters. Scroll through the alignment. You will see that there are some regions that are aligned far better than others.
An example of a poorly aligned region:
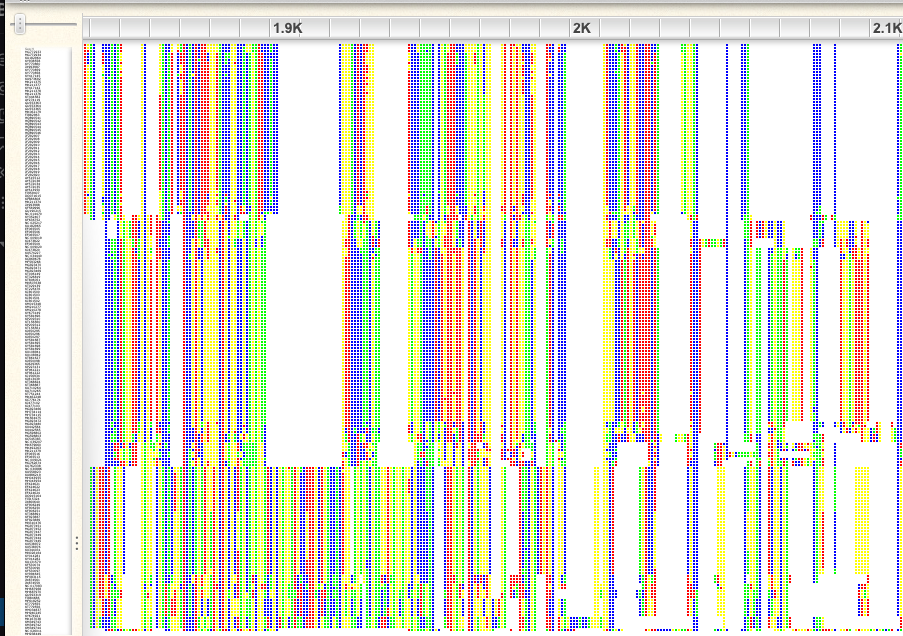
An example of a well-aligned region:
If you look at the first 1,000bp, you will see that there are some sequences that have gaps in otherwise very well conserved regions. A similar problem exists at the end of the alignment. Probably these are incomplete sequences, so we will plan to trim them. We will trim both of these regions, later in R.
There are also many gap-rich regions, where the alignment did not work well. We will also plan to trim these in R. You can get an idea for what removing gappy sites looks like by clicking on the gear icon in Wasabi and choosing “Hide gaps” and choosing a 75% threshold. This makes the missing data at the beginning and end of the alignment easier to see.
In theory we could do the trimming and export from Wasabi itself, but in practice that does not work well with this many sequences of this length, so we will turn to R.
Exercise 15:
If you turned on a gap threshold in the viewer, undo it by clicking on the undo button:

For each of the the following regions classify them as well- or poorly aligned, or uncertain/intermediate and explain your reasoning:
- 39.1K to 39.4K
- 31.6K to 31.9K
- 24.7K to 24.9K
- 14.5K to 14.7K
Some additional notes on alignments:
We are really doing a pretty quick and dirty job of editing of the alignment. If we were going to do this in more detail, we might use a program like gblocks to more systematically prune poorly aligned regions (although for the most part I think the 75% gap cutoff results in a reasonable alignment). An alternative approach would be to focus on a few genes that are conserved among these viruses, and then use an amino-acid or codon guided alignment using software like PRANK.
Subset sequences
Now that we have found a region we want to use for tree construction, we would use R to subset the sequences. See the non-web-only version of this lab for the code that was used.
You don’t need it for today’s lab, but if you want a copy of the trimmed sequences, you can download it here
Build a tree
Like everything else in this lab, there are a myriad of phylogenetic tree reconstruction algorithms and programs. There is a consensus that you want to use a Maximum Likelihood or Bayesian approach, not Maximum Parsimony and not Neighbor Joining.
I used FastTree because it offers a good balance of accuracy and speed. Again this can be more of an art.
I used:
FastTree -nt -gtr -gamma -out mafft_maxiter100_195v2_op.5_trimmed.fasttree.tre mafft_maxiter100_195v2_op.5_trimmed_75pct.fa
(Takes less than 2 minutes)
Where
-ntspecifies that this is a nucleotide alignment-gtrspecifies that we want to use the General Time Reversible model for nucleotide substitution-gammaimproves the maximum likelihood estimates-outspecifies what we want the output file to be named- the final argument is the input file.
Examine the tree
Again, there are many tree viewing programs. I like the web-based viewer iTOL.
Download the tree file to your copmuter and then upload it to iTol
Upload the mafft_maxiter100_195v2_op.5_trimmed.fasttree.tre file to iTol.
For improved viewing, do the following:
- Basic tab
- Mode: “Rectangular”
- Label options, Position: “At tips”
- Advanced tab
- Bootstraps / metadata: “Display”
- Legend: On
(Now the circles at each internal node indicate support for the node: 1 is best, 0 is worst).
You can now use the + and - buttons to make the tree larger and smaller. Clicking on the tree and scrolling allows you to move around.
Exercise 16:
A: What is the sister taxon to Seq_H? What is the host for the virus in this group (provide the Latin and common names)
hint: if you are having trouble finding Seq H in the tree, search for it using the (Aa) magnifying glass
B: Consider Seq_H plus its sister taxa as defining one taxonomic group of three species. Look at the sister taxa to this group. What is a general description for the viruses in this group? List at least 3 different hosts found in this group. Give Latin and common names (if there is a common name).
C: Now consider Seq_H plus all of the other taxa used in question B as one taxonomic group. The sister to this group has three members. What are the hosts of this group.
D: Given your above findings, what do you think the host of the most recent common ancestor to the viruses in parts A and B was? (You can answer giving the common name for the general type of organism, e.g. rat, mouse, bat, ape, etc. you do not need to give a precise species).
E: Do you think that Seq_H evolved from a virus with a human host? Why or why not? If not, what did it evolve from?
Congratulations! You have identified the likely evolutionary origin of the COVID-19 virus.
Evolution of the Spike (S) protein
The SARS Covid-19 S or Spike protein is a glycoprotein found on the surface of the virus and responsible for binding to host cells and subsequent membrane fusion and entry (wikipedia spike protein). It is also highly immunogenic and the target of most Covid-19 vaccines.
Given its importance to viral function it might be interesting to examine the evolutionary changes that occured between the bat and human hosts.
We will do a simple analysis that compares the rate of nucleotide substitutions that cause amino acid changes (non-synonymous changes) to those that do not (synonymous changes). The ratio of these rates (dN/dS or Ka/Ks) is a measure of the evolutionary pressure acting on the gene (wikipedia KaKs).
Ka/Ks ratios of 1 indicate neutral selection (amino acid changes are neither selected for or against). Ratios of less than one indicate purifying selection (most amino acid changes are selected against). Ratios greater than one indicate positive selection (amino acid changes are favored). In the simple test we are going to do here it is important to remember that we will get an estimate of the average Ka/Ks across the whole protein.
Exercise 17:
Make a hypothesis about what you expect the Ka/Ks ratio to be when comparing the S gene from SARS2 with a human versus a bat host. Explain you reasoning. There is no wrong answer here so long as you explain your reasoning.
End of Exercise 17
Gather the sequences and perform pairwise alignment
To perform this analysis we need to do a pairwise sequence alignment of the S genes from Bat and Human infecting viruses.
See the non-web-only version of this lab to see how this was done
Exercise 18:
SKIP EXERCISE 18
Exercise 19
Download the aligned spike proteins.
View the alignment in Wasabi. Any concerns? It may be helpful to display the alignment as codons and/or protein (click on the gears and select translate). Note: if you view as protein, you will have to reload the file to see nucleotides again.
End of Exercise 19
Calculate KaKs
Regardless of any concerns about the alignment, let’s go ahead and claculate KaKs
The tool that we will use for KaKs calculation requires a different object type than a DNAStringSet. The easiest thing to do is just to read the alignment back in.
spike_aligned_seqinr <- seqinr::read.alignment("../output/spike_aligned.fa", format = "fasta")
spike_kaks <- seqinr::kaks(spike_aligned_seqinr)
spike_kaks
The results are below
## $ka
##              Seq_H
## MG772934 0.1190342
##
## $ks
##             Seq_H
## MG772934 1.154126
##
## $vka
##                 Seq_H
## MG772934 0.0001063036
##
## $vks
##                Seq_H
## MG772934 0.009775355
Exercise 20
Calculate Ka/Ks, using the spike_kaks numbers above (you can just use your phone calculator). Then, interpret the result. Assuming our alignment was okay, what does this tell you about how this protein is evolving? Does this match your hypothesis? If the results do not match your hypothesis, could your hypothesis still be correct, in a modified form?